
On this page
Base rate neglect is giving too little weight to how common an outcome is when interpreting evidence about it. A persuasive description, alert or recent headline can feel decisive even when the outcome remains uncommon. The correction is to combine the starting probability with how well the evidence distinguishes that outcome from alternatives.
Base rate neglect is often called the base rate fallacy. It is not a rule to ignore new evidence: sufficiently informative evidence should change a forecast. The mistake is updating without accounting for the starting frequency or prior probability.
What is a base rate?
A base rate is the frequency of an outcome in a relevant comparison group. If 50 of 1,000 comparable projects miss a deadline, the observed delay rate is 5%. That can be a starting point for forecasting another comparable project, before incorporating its specific circumstances.
The comparison group matters. A historical rate from small, routine projects may be a poor prior for a first-of-its-kind megaproject. State the group, observation period and uncertainty rather than presenting one historical percentage as timeless.
Base rate neglect example: a project-delay alert
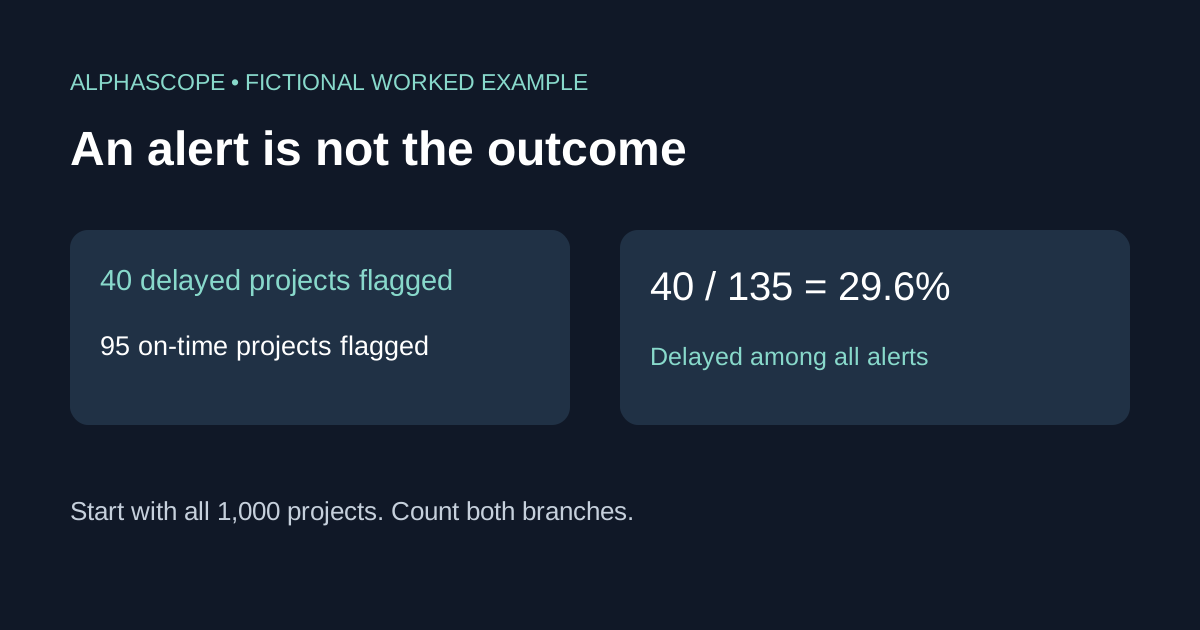
Consider this invented scenario. Among 1,000 comparable projects, 50 eventually miss their deadline and 950 do not. An alert system flags 80% of the delayed projects, but also flags 10% of the on-time projects.
| Actual outcome | Projects | Alert rate | Flagged projects |
|---|---|---|---|
| Delayed | 50 | 80% | 40 |
| On time | 950 | 10% | 95 |
| Total flagged | — | — | 135 |
Among flagged projects, the delayed share is 40 ÷ 135 ≈ 29.6%. The alert raises the probability from 5% to about 29.6%, but it does not make delay 80% likely. The 80% figure describes how often delayed projects trigger an alert, not how often alerted projects are delayed.
Many more on-time projects exist in the starting population. Even their smaller alert rate therefore contributes 95 flagged cases. Ignoring that group is the central denominator mistake.
Calculate it with Bayes’ rule
Let D mean delayed and A mean an alert. Then:
P(D | A) = P(A | D) × P(D) / [P(A | D) × P(D) + P(A | not D) × P(not D)]
Substituting the fictional inputs gives (0.80 × 0.05) / [(0.80 × 0.05) + (0.10 × 0.95)] = 0.04 / 0.135 ≈ 0.2963. The result agrees with counting the 40 delayed cases among all 135 alerts.
A useful sensitivity check changes only the base rate. If the delay rate were 20%, with the same conditional alert rates, 160 delayed and 80 on-time projects would be flagged per 1,000. The posterior would be 160 ÷ 240 ≈ 66.7%. The same alert can mean different things in different populations.
Why counts can make the problem easier
Writing “40 out of 135 alerts” makes the relevant groups visible. A 2015 study by Hoffrage, Krauss, Martignon and Gigerenzer found that natural-frequency presentations improved performance on the Bayesian reasoning tasks they studied. That supports trying a frequency table; it does not guarantee that any particular forecast is accurate.
Keep every branch tied to the same starting population. Do not combine a true-positive rate measured in one group with an unrelated false-positive rate and assume the resulting estimate is validated.
How base rate neglect affects forecasting
In event research, a dramatic news report can draw attention away from how often comparable events occur. Before making a large update, ask how likely this report would be if the event did not happen. A signal that appears frequently in both outcomes may deserve less weight than its vividness suggests.
Also check whether your starting forecast already includes the report. Counting the same evidence twice can exaggerate the update. Several articles repeating one original claim are not automatically independent signals.
A market price can be a useful comparison point, but it is not necessarily the historical base rate for your chosen reference class. Keep your reference frequency, current estimate and the venue’s executable price distinct.
How to avoid base rate neglect
- Define the event: specify the outcome, deadline and relevant comparison group.
- Write the prior: record the base rate and why it applies.
- Evaluate the signal: consider its frequency when the event happens and when it does not.
- Count both branches: use a table or Bayes’ rule with consistent inputs.
- Check sensitivity: vary uncertain assumptions and record what changes.
- Review forecasts: compare dated predictions with outcomes, preserving mistakes as well as successes.
For that final review, our Brier score calculator evaluates binary probability forecasts. It measures forecasting error rather than diagnosing a specific bias. Use Alphascope news to investigate evidence while keeping the starting probability and update rationale in your research notes.