
On this page
There is no defensible single Polymarket accuracy percentage without a defined dataset and evaluation method. A market price expresses an implied probability, not a guaranteed result. To evaluate performance, specify which contracts, which forecast time, which resolved outcomes and which metric you used.
This guide explains a reproducible method. It does not report a new empirical Polymarket backtest or claim that the platform outperforms polls.
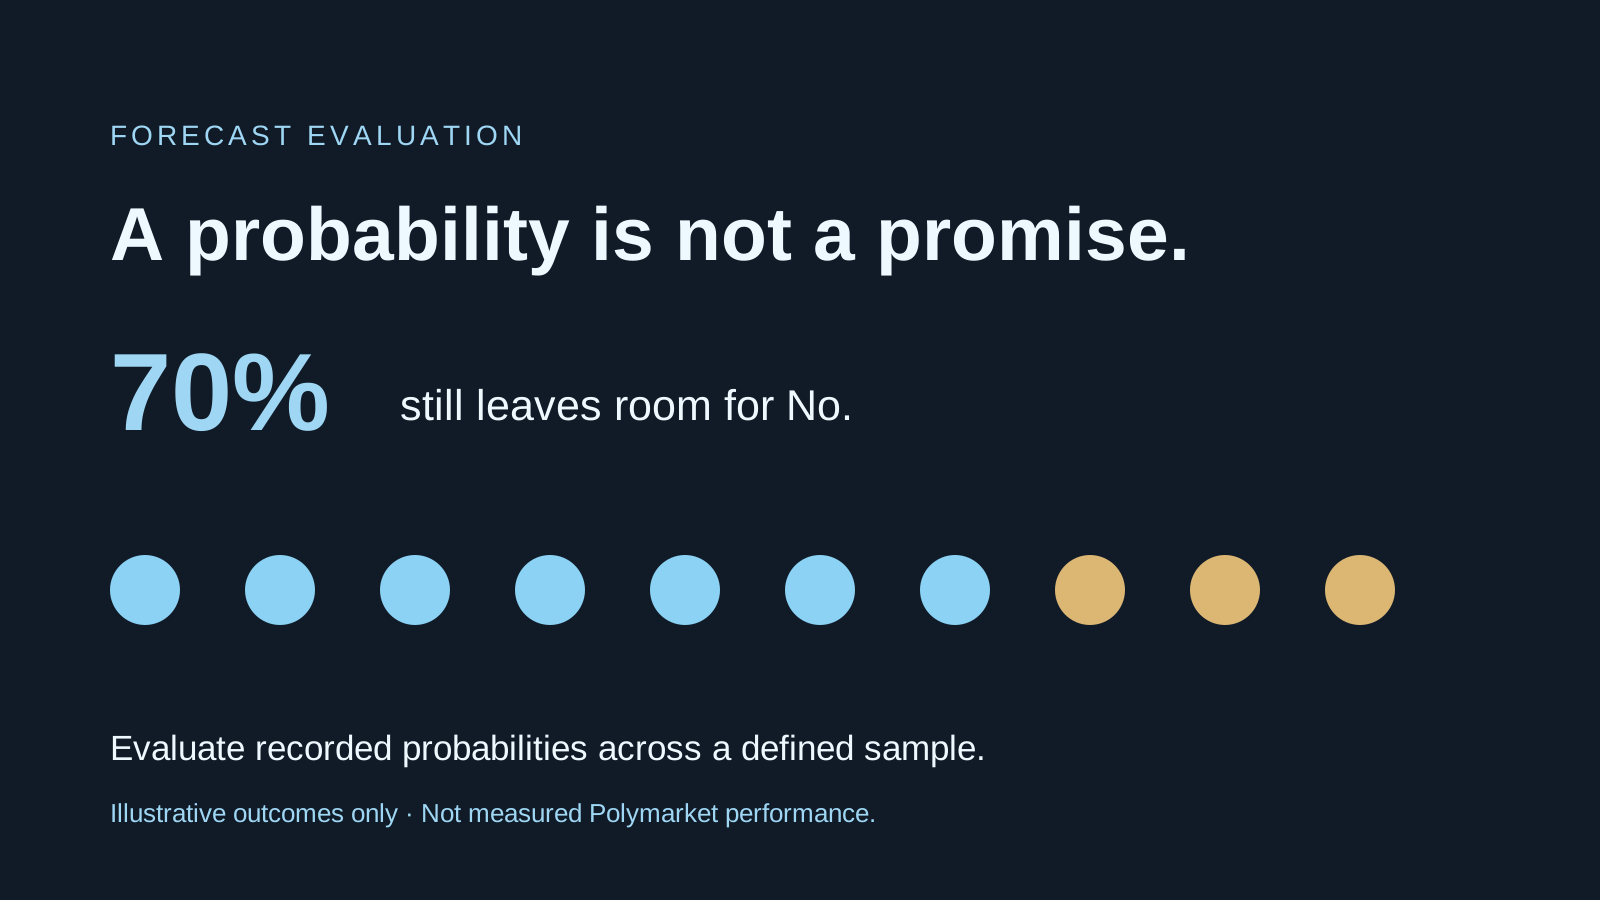
A 70% forecast can lose and still be reasonable
A probability forecast assigns uncertainty. One event resolving No does not by itself establish that a 70% Yes forecast was badly calibrated. Across an appropriately selected set of similar 70% forecasts, compare the observed Yes frequency with the probabilities recorded beforehand.
A screenshot of a favorite winning is also insufficient evidence. A forecast assigning 51% and one assigning 99% both favor Yes, but they make very different probability claims.
Choose the sample before looking at the results
| Decision | What to record |
|---|---|
| Eligible contracts | Category, dates and inclusion rule |
| Forecast horizon | For example, a fixed time before the event |
| Probability | Exact outcome side, price definition and timestamp |
| Resolution | Final binary outcome and governing rule |
| Exclusions | Missing prices, cancellations and nonbinary payouts |
Use one observation per outcome at your chosen horizon. Hundreds of timestamps for one election do not become hundreds of independent elections. Preserve missing cases rather than silently keeping only easy-to-score contracts.
Price history is only part of the dataset
Polymarket's international price-history documentation describes a historical-price endpoint. Historical prices still need to be joined to exact outcome identifiers and final resolutions. A chart alone does not provide the complete sample needed for accuracy claims.
Keep US and international products separate. Their contracts and data workflows can differ. Start with the documentation for the actual product instead of mixing similarly named markets into one result.
Use a probability score
For a binary forecast, the Brier score is (p − y)², where p is the probability from 0 to 1 and y is 0 or 1. Average the individual scores; lower is better. This binary convention is documented in the scoringrules reference. Some multiclass conventions double the binary score, so keep the convention explicit.
Try your own recorded forecasts in the Brier score calculator. It also shows descriptive probability bins and a constant 50% baseline. It does not fetch Polymarket data or verify the rows you enter.
A worked example, not a platform result
| Forecast probability | Actual Yes outcome | Squared error |
|---|---|---|
| 70% | 1 | 0.09 |
| 20% | 0 | 0.04 |
| 90% | 0 | 0.81 |
| 40% | 1 | 0.36 |
The mean is 0.325. All four rows are invented. They illustrate why a confident wrong forecast receives a larger penalty than a less confident wrong forecast.
A constant 50% forecast scores 0.25 on every binary event. That is one simple baseline, not necessarily the best benchmark for your category. Report the chosen benchmark and use the same sample when comparing it.
Inspect calibration without overstating it
Group probabilities into predefined bins, then compare each bin's mean forecast with its observed Yes frequency. Report the count in each bin. A bin containing one event can show 0% or 100% observed frequency without supporting a broad conclusion.
One low average score does not by itself prove calibration across every category. Show categories, forecast horizons and sample limitations. If you compare markets with a model or polls, use identical events, outcome definitions and forecast times.
Accuracy and trading returns are different
A better-scoring forecast can still produce losing trades after price, fees and depth. A public price can also be unavailable for your intended size. Use the EV calculator to distinguish your probability from the trade cost and the slippage calculator to explore depth assumptions.
Alphascope supports market research. Evaluate any forecast system with records you can audit, not selected wins or an unsupported accuracy headline. Sources checked October 6, 2026.