
On this page
Reference class forecasting estimates an outcome using the actual results of comparable past cases. Instead of relying entirely on a detailed story about why this case will succeed, start with what happened to similar cases. Then explain any adjustment for differences.
This “outside view” is useful when a forecast is vulnerable to optimism, selective examples or an unusually persuasive plan. It is a starting distribution, not a guarantee that history will repeat.
For the bias this outside view can help address, see our planning fallacy guide, which separates desired deadlines from completion forecasts.
How the method works
Choose a relevant comparison group, collect consistent outcome measurements, and use their distribution to inform the new forecast. The Homes England reference class forecasting report describes an application to project costs and schedules, using historical comparable projects to inform uncertainty and contingency. Its guidance is specific to that setting; the fictional example below illustrates the general reasoning rather than reproducing its workbook.
- Define the target: exactly what quantity or event are you forecasting?
- Select comparable cases: state inclusion and exclusion rules before examining desired results.
- Build a distribution: retain the range and tails, not just an average.
- Assess differences: document why this case might depart from the group.
- Record and review: compare the forecast with the eventual outcome.
A worked reference class forecasting example
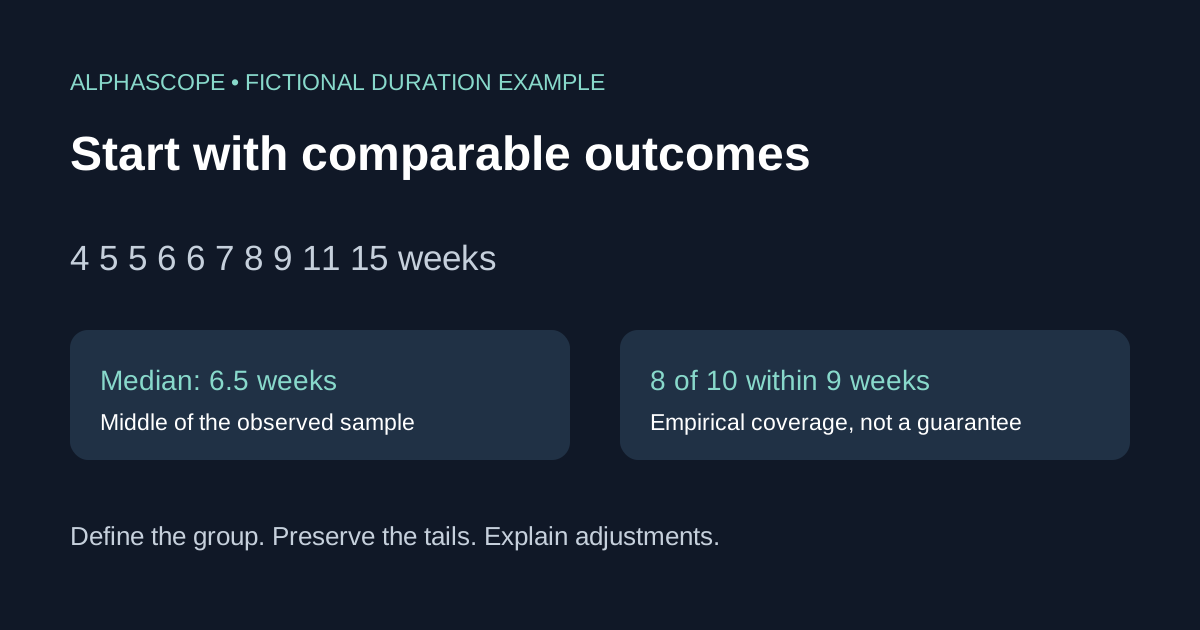
Suppose a fictional team wants to forecast the duration of a routine integration project. It identifies ten completed integrations with similar scope, staffing and a consistent start-to-finish definition. Their durations, sorted in weeks, are:
4, 5, 5, 6, 6, 7, 8, 9, 11, 15
| Question | Calculation | Result |
|---|---|---|
| What is the median? | (6 + 7) ÷ 2 | 6.5 weeks |
| What is the mean? | 76 ÷ 10 | 7.6 weeks |
| What share finished within 8 weeks? | 7 ÷ 10 | 70% |
| What is the empirical 80th percentile using nearest rank? | Position ceil(0.8 × 10) = 8 | 9 weeks |
The 15-week case pulls the mean above the median. An eight-week plan covers seven of the ten observed outcomes, while a nine-week threshold covers eight. These are descriptions of this invented sample, not validated probabilities for a real project. Percentile conventions differ, so state which one you use.
The hardest step is choosing the reference class
A broad class gives more observations but may mix unlike cases. A narrow class may look relevant while containing too little data. Compare scope, measurement definitions, technical novelty and the period in which the work occurred.
Do not quietly remove the 15-week outcome because it looks inconvenient. Investigate whether it is a recording error, an ineligible case under a predeclared rule, or a genuine tail outcome. If its exclusion changes the answer, show both results and the reason.
Completed cases alone may also miss cancelled or still-running projects. Define how those cases enter your dataset so survivorship and incomplete observation do not silently make performance look better.
Combine the outside view with case-specific evidence
A project manager might argue that a new tool shortens delivery. That is a testable reason to adjust the reference forecast, but “our team is better” is not a quantified adjustment. Ask whether similar teams using that tool actually finished faster, and whether the evidence was available when the forecast was made.
Use a sensitivity analysis when comparison quality is uncertain: report the result for a broader group and a defensible narrower group. A precise-looking decimal cannot repair an unsuitable reference class.
Applying the idea to event forecasts
For a binary question, the outside view could be the observed frequency of the same clearly defined outcome among comparable cases. Align the deadline and resolution criteria before counting. “A project was announced” and “a project was completed by the deadline” require different datasets.
Our base rate neglect guide shows how a starting probability combines with new evidence. Our Metaculus AGI guide demonstrates why similarly named milestones can still define different events.
A reference class worksheet
- Target outcome, measurement unit and forecast date.
- Eligibility rules, data source and comparison period.
- Sample size, missing cases and treatment of cancellations.
- Distribution, chosen percentile convention and tail outcomes.
- Case-specific adjustment, evidence and sensitivity range.
- Final dated forecast and later outcome review.
For binary forecast review, the Brier score calculator measures probability error. It does not score project durations directly. Alphascope’s market news can support evidence gathering; preserve the source and timestamp alongside any update to your forecast.