
On this page
Adverse selection occurs when information differences affect who agrees to a transaction, leaving the other side with a less favorable mix than it expected. A buyer may attract disproportionately low-quality goods. A liquidity provider may get filled disproportionately when the quoted price has become unfavorable.
The key is selection: the people or trades that accept an offer need not be a random sample of everyone who could accept it. In prediction markets, this matters when evaluating a resting order’s expected value.
What is adverse selection?
One side knows something relevant that the other side does not, and that information influences participation. Knowing the average value in the entire population is then insufficient. You also need the expected value among the transactions that actually occur.
Jonathan Levin’s research on the market for lemons studies sellers with private information and buyers who must account for the decision to sell. Its results also caution against an automatic claim that every increase in information asymmetry must reduce trade: the model’s supply and demand effects both matter.
Adverse selection is not simply “a bad outcome.” A purchase can lose money because of ordinary uncertainty even when both sides have identical information. Conversely, selection can make an offer unfavorable in expectation before any outcome is known.
An original example: the offered goods differ from the whole pool
Imagine 100 fictional used devices: 50 reliable and 50 unreliable. Buyers value a reliable device at $120 and an unreliable one at $40. Owners know their device’s type; buyers initially cannot distinguish them. Reliable owners require at least $100 to sell, while unreliable owners will accept $30. Ignore transaction costs and all other differences.
The average buyer value across all 100 devices is $80. But offering $80 does not buy a representative sample: reliable owners decline, while unreliable owners accept. Under these stipulated choices, the devices offered at $80 have buyer value $40, giving a buyer a $40 loss per purchase.
| Group | Buyer value | Owner’s minimum | Accepts $80? |
|---|---|---|---|
| 50 reliable devices | $120 | $100 | No |
| 50 unreliable devices | $40 | $30 | Yes |
This is an invented teaching example, not Levin’s numerical model or an empirical estimate. It shows why pricing the full pool without considering participation can fail. It does not establish that every real market collapses.
Why insurance is a common example
Suppose applicants privately know something about their risk, and higher-risk applicants are more willing to buy a particular policy at its quoted premium. The insured pool can then have greater expected claims than the broader eligible population. A pricing calculation that assumes random participation can miss that difference.
This is the information-and-participation mechanism, not a claim that every person buying coverage has high risk. Actual policy design, information, incentives and eligibility can change the selection pattern.
Adverse selection vs moral hazard
| Question | Adverse selection | Moral hazard |
|---|---|---|
| What creates the problem? | Hidden information influences which counterparties or transactions participate | Hidden actions or changed incentives affect behavior under an arrangement |
| Teaching example | Owners who know a device has problems are especially willing to sell at a pooled price | A participant takes less care because an arrangement shifts some consequences elsewhere |
| What to examine | How participants differ from the eligible pool | What actions and incentives the arrangement changes |
“Before versus after a contract” is a useful first approximation, but the mechanism matters more than a calendar label. Both problems can occur within the same relationship. Neither term by itself proves dishonesty.
Prediction-market example: condition on getting filled
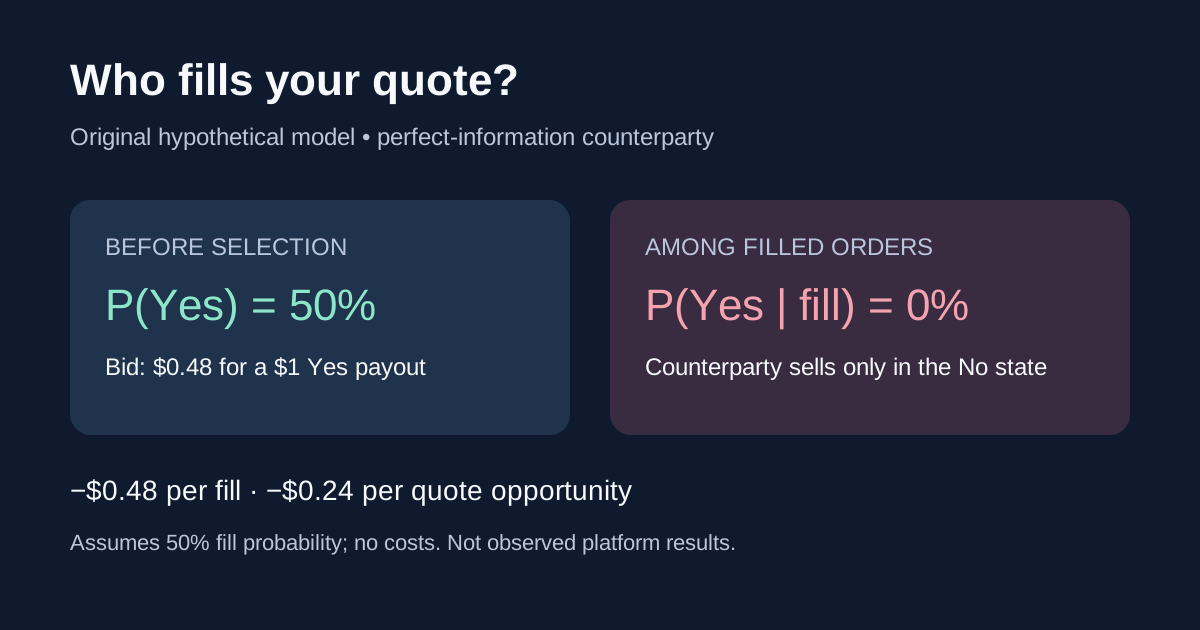
Consider a fictional binary contract paying $1 for Yes and $0 for No. Before observing a new signal, Yes and No each have probability 50%. You leave a bid to buy one Yes contract at $0.48. Another trader observes the outcome perfectly before your quote updates.
Assume that trader sells to your bid whenever the outcome is No and never sells when it is Yes. There are no other traders, fees, rewards, cancellations or execution constraints in this deliberately extreme model.
| State | Prior probability | Bid filled? | Profit if filled |
|---|---|---|---|
| Yes: payout $1 | 50% | No | No transaction |
| No: payout $0 | 50% | Yes | −$0.48 |
Using the unconditional 50% probability would suggest $0.50 −$0.48 =+$0.02 per purchase. But here the conditional probability of Yes given a fill is zero. Every executed purchase loses $0.48. With a 50% fill probability, the expected result per quote opportunity is 0.50 ×(−$0.48) =−$0.24.
That distinction separates profit per executed contract from profit per quote opportunity. A backtest that gives a resting order the population’s average outcome while ignoring who fills it can manufacture an apparent edge.
The perfect-information assumption is for explanation, not a description of Kalshi or Polymarket traders. Real selection can involve noisy forecasts, faster processing of public news, inventory needs and mixed order flow. No claim about a particular trader’s knowledge or conduct follows from this example.
For the broader role of matching rules, displayed depth and execution benchmarks, see our market-microstructure guide.
What a post-trade price move can and cannot show
For a simple descriptive markout, compare your execution price with a consistently defined later midpoint. If you buy 100 contracts at $0.48 and the midpoint at a prespecified horizon is $0.44, the marked change is 100 ×($0.44 −$0.48) =−$4. If the later midpoint is $0.51, it is +$3.
A midpoint is a reference, not necessarily an executable exit price. These are paper valuation changes, not realized sales or final settlement profits. Record the horizon, quote timestamp and available depth; a stale or missing midpoint can make the comparison meaningless.
The SEC’s historical execution-disclosure discussion explains how realized spreads can help study informed and uninformed order routing. It concerns securities execution measurement, not prediction-market reporting requirements. A New York Fed research model separately distinguishes liquidity costs from adverse-selection costs and studies information disclosure.
Negative markouts across a defined sample can motivate investigation. A single unfavorable move does not establish private information, manipulation or wrongdoing. General price moves, measurement choices and your own execution can also affect the result.
For a different market-integrity question, compare the official records in our wash-trading case guide. A trade selected by a better-informed counterparty is not automatically a wash trade.
A practical research checklist for resting orders
- Define the sample first. Include every eligible quote opportunity, including no fills, partial fills and cancellations.
- Keep both denominators. Report results per executed contract and per quote opportunity separately.
- Fix observation horizons. Do not choose the most favorable later price for each fill.
- Separate components. Track trading cash flows, inventory marks, fees, rebates and rewards without counting a valuation change twice.
- Inspect information timing. Match public announcements, your data arrival, quote updates and executions where records allow.
- Test operational assumptions. A cancellation request and a confirmed cancellation are different events.
For venue-specific context, read our Polymarket market-making guide. The expected-value calculator evaluates supplied probabilities and costs; it does not estimate conditional fill selection. Alphascope’s market news supports event research, while execution analysis requires its own timestamped records.