
On this page
Implementation shortfall measures the gap between a decision-price paper portfolio and the portfolio actually implemented, including trading costs and relevant unfilled quantity. A favorable fill price alone does not establish that the whole investment decision was implemented well.
CFA Institute’s 2026 trading-cost overview includes explicit costs and implicit costs such as delay, market impact and missed trades in this framework. This guide develops original numerical examples for a simple linear instrument; it does not report observed Kalshi or Polymarket execution performance.
Start with the decision, not the first fill
Write down the intended direction, quantity and decision-time benchmark before examining execution results. Also fix the final valuation time and identify which costs are included. If the intended order changes, preserve the change as a new decision rather than silently rewriting the original target.
Larry Harris’s transaction-cost discussion stresses that opportunity-cost estimates need a benchmark, a valuation price and a realistic estimate of fillable quantity. A huge desired order that could never have traded should not automatically be treated as a missed executable opportunity.
Implementation shortfall calculation for a purchase
For the simplified setup below, let Q be intended quantity, q executed quantity, p0 decision price, pFill average execution price, pEnd the prespecified ending valuation price and C explicit costs in dollars.
Buy shortfall = q ×(pFill −p0) +(Q −q) ×(pEnd −p0) +C.
The first term compares executed quantity with the decision benchmark. The second values the unfilled remainder relative to that benchmark. This is an accounting decomposition, not proof that your order caused the entire price difference.
Assume no financing, interest, distributions, transfers or other position changes. All prices use dollars per unit, quantity has no hidden multiplier and costs are recorded once. More complicated products require their actual cash-flow and valuation conventions.
Original example: buy 100, fill 60, leave 40 unfilled
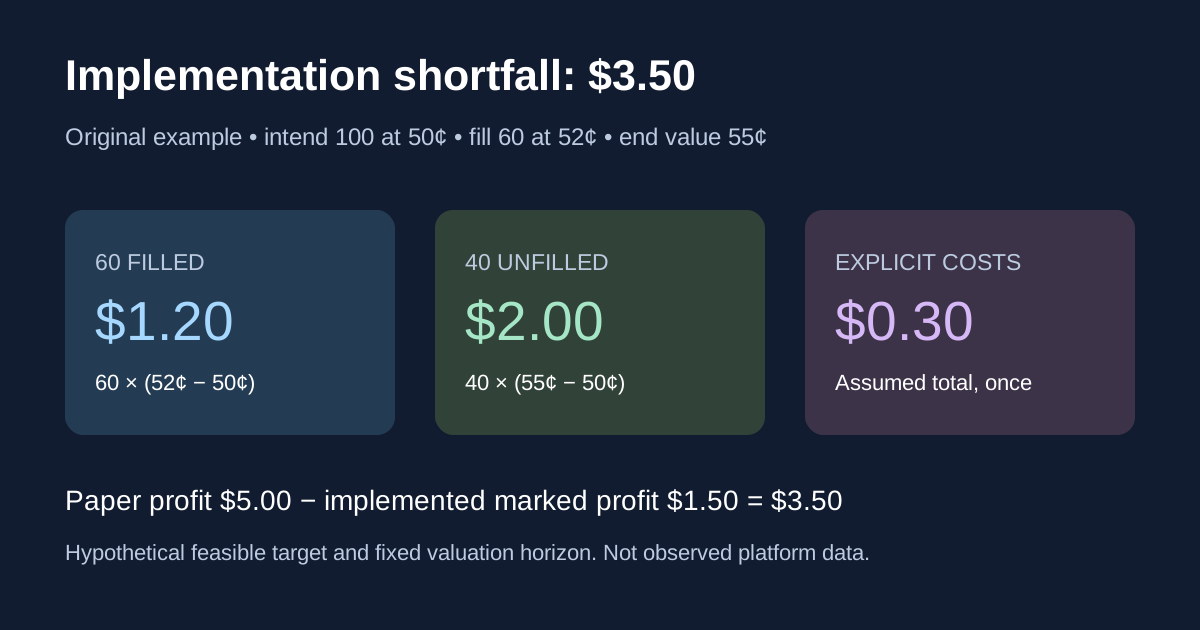
At the decision time, a fictional participant intends to buy 100 units at a $0.50 benchmark. Assume all 100 are a reasonably feasible target for this teaching comparison. Actual execution buys 60 at $0.52. The remaining 40 never trade. At the chosen ending horizon, the valuation price is $0.55. Total explicit costs are $0.30.
| Component | Calculation | Shortfall |
|---|---|---|
| Executed quantity | 60 ×($0.52 −$0.50) | $1.20 |
| Unfilled remainder | 40 ×($0.55 −$0.50) | $2.00 |
| Explicit costs | Stipulated total | $0.30 |
| Total | $1.20 +$2.00 +$0.30 | $3.50 |
Checking only the 60 fills would report $1.50 including costs and omit the $2.00 unfilled component. These are invented records, not a venue fee schedule or a claim that the benchmark price was actually available for the full size.
Check the answer using paper profit minus actual profit
For the hypothetical paper purchase, all 100 units are bought at $0.50 and valued at $0.55: 100 ×($0.55 −$0.50) =$5.00. No transaction costs are assigned to this paper benchmark.
The implemented position contains only 60 units. Its marked profit after the stipulated costs is 60 ×($0.55 −$0.52) −$0.30 =$1.50. Paper profit minus implemented profit is $5.00 −$1.50 =$3.50, agreeing with the component table.
The $2.00 associated with the remainder is a comparison with the paper portfolio, not a cash debit or a realized loss on 40 purchased units. Those units were never bought. Similarly, valuing the 60 held units at the ending reference does not establish that an actual sale occurred there.
Expressing the result in basis points
Here the stated denominator is the original paper purchase value: 100 ×$0.50 =$50. The shortfall is $3.50 ÷$50 =7% =700 basis points.
Dividing by the actual purchase outlay, $31.20 before costs, answers a different normalization question. Always state the denominator alongside a percentage or basis-point figure. A value per filled unit also differs from a value per intended unit.
Can implementation shortfall be negative?
Yes. Keep the same buy decision, fills and costs but change only the ending valuation price to $0.45. The executed component remains $1.20; the remainder component becomes 40 ×($0.45 −$0.50) =−$2.00. Adding $0.30 costs gives −$0.50.
The paper position loses $5.00 while the implemented position loses $4.50 after costs. Thus −$5.00 −(−$4.50) =−$0.50. Negative shortfall means the implemented result is better than this benchmark by $0.50; it does not turn the actual $4.50 marked loss into a profit.
Reverse the price-difference signs for a sale
For a sale, worse execution means receiving less. In the analogous simple setup, use sell shortfall = q ×(p0 −pFill) +(Q −q) ×(p0 −pEnd) +C.
Suppose the participant starts holding 100 units and decides to sell all at a $0.50 benchmark. Only 60 sell at $0.48; 40 remain and are valued at $0.45. Costs are $0.30. The three components are $1.20, $2.00 and $0.30, again totaling $3.50.
The paper liquidation produces $50. The implemented ending wealth from this position is 60 ×$0.48 +40 ×$0.45 −$0.30 =$46.50. The $3.50 gap confirms the sign convention without applying a buy formula to a sell order.
A shortfall number does not explain every cause
Harris’s discussion connects the combined transaction and opportunity costs to paper profits minus implemented profits. It also notes that individual-order estimates can be noisy. The identity reconciles the record; causal attribution requires more evidence.
For example, a move between decision and execution can include news unrelated to the order. A chosen ending horizon can change the unfilled component. A midpoint is a reference rather than a guaranteed exit. Keep these limitations visible when comparing orders or execution approaches.
A low fee or a good price for a small fill is not by itself an evaluation of the full intended transaction. Conversely, this ex-post comparison cannot prove that a faster alternative was available without different costs or risks.
Record a reproducible execution comparison
Download the blank shortfall worksheet. Record the intended order, realistic fillable target, benchmark, fill ledger, explicit costs and fixed valuation horizon. Preserve missing entries instead of substituting zero.
For prediction-market research, also preserve the exact venue, instrument and outcome identifier. An interim valuation is not a final event payout. Our market-microstructure guide explains execution mechanisms; the slippage calculator explores supplied price levels but does not measure unfilled opportunity cost. Use event research and execution records for their separate purposes.