
On this page
Price improvement means receiving an execution price better than a specified quote benchmark. For a buy, a lower execution price is better; for a sell, a higher execution price is better. To compare price improvement across brokers, first match the benchmark, measurement time, order population and denominator. A larger dollar headline alone does not establish better execution.
This guide uses original hypothetical calculations to explain those comparisons. The report labels A and B below are fictional datasets, not actual brokers, tests or rankings.
What is price improvement in trading?
In a stock comparison against the national best bid and offer, a buy executed below the national best offer receives price improvement; a sell executed above the national best bid does. Schwab’s Rule 605 definitions distinguish strictly better prices from executions merely at the quote.
Use a benchmark with a defined timestamp. A screenshot’s displayed quote, a quote when an order reaches a broker, and a quote at a later execution time can differ. The SEC’s Rule 605 staff FAQ explains why receipt timing matters for execution benchmarks. Do not silently switch timestamps between the results being compared.
Original buy and sell examples
Suppose the stipulated benchmark is a $39.96 bid and $40.04 offer. Assume the quoted size covers the example quantities, and ignore fees and price changes.
| Side | Execution | Relevant benchmark | Improvement per share | Quantity | Total |
|---|---|---|---|---|---|
| Buy | $40.02 | $40.04 offer | $40.04 −$40.02 =$0.02 | 150 | $3.00 |
| Sell | $39.99 | $39.96 bid | $39.99 −$39.96 =$0.03 | 80 | $2.40 |
The buy formula is quantity ×(benchmark offer −execution price). The sell formula is quantity ×(execution price −benchmark bid). These are signed comparisons: a negative result means a worse execution relative to that stipulated benchmark. A sell should not reuse the buy formula’s direction.
The midpoint is $40.00. The buy at $40.02 improves on the offer by two cents but remains two cents above the midpoint. “Better than the offer” therefore does not mean “at the midpoint,” and neither statement determines the position’s subsequent investment return.
How different denominators reverse the headline
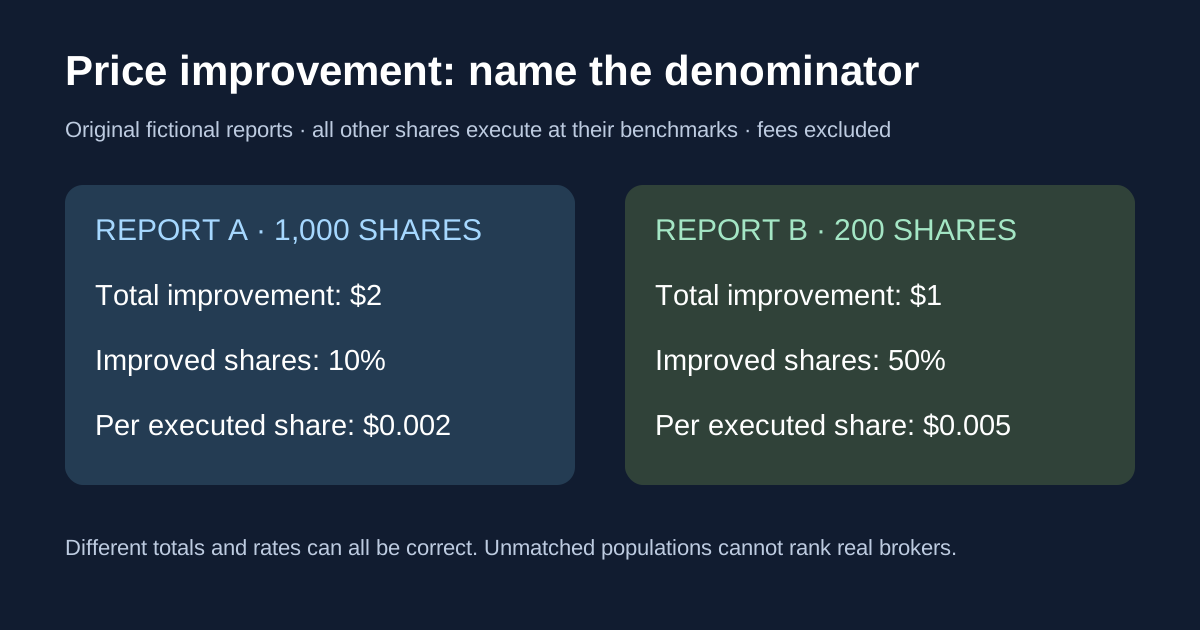
Construct two fictional reports. In A, 1,000 shares execute: 100 receive two cents of improvement each, and 900 execute exactly at their benchmark quotes. In B, 200 shares execute: 100 receive one cent each, and 100 execute exactly at their benchmarks. There are no worse-than-quote executions in either dataset. Ignore fees.
| Measure | Fictional A | Fictional B |
|---|---|---|
| Executed shares | 1,000 | 200 |
| Price-improved shares | 100 | 100 |
| Total improvement dollars | $2.00 | $1.00 |
| Improved-share frequency | 100 ÷1,000 =10% | 100 ÷200 =50% |
| Dollars per improved share | $2 ÷100 =$0.020 | $1 ÷100 =$0.010 |
| Dollars per executed share | $2 ÷1,000 =$0.002 | $1 ÷200 =$0.005 |
A has more total improvement dollars and a higher average improvement among improved shares. B has a higher frequency and more improvement dollars per executed share. All four observations are mathematically consistent.
The last row is 0.2 cents versus 0.5 cents per executed share, not 0.2 dollars versus 0.5 dollars. Keep dollars and cents labeled. Also distinguish share-weighted statistics from order-weighted statistics: a 1,000-share execution and a 10-share execution do not receive equal weight in a share-weighted average.
These unmatched toy populations cannot establish which real broker would execute your order better. They show why a comparison must identify the numerator, denominator and order mix before interpreting the headline.
“At quote or better” is different from “price improved”
Every share in both fictional datasets executes at its benchmark or better, so that frequency is 100% for A and B. Strict price-improvement frequency remains 10% and 50%. A 100% at-quote-or-better rate does not mean every share received a strictly better price.
Schwab’s current definitions separate those categories and use all executed shares from the same orders as the denominator. Its explanation also cautions that different order populations and market conditions affect report comparisons. Match the period, security or liquidity category, size bucket, order type and relevant exclusions before drawing conclusions.
Dollar averages are not every percentage statistic
The fictional table contains no price disimprovement. If a separate hypothetical dataset has $3 of gross improvement but $4 of worse-than-benchmark executions, its signed net improvement is $3 −$4 =−$1. Reporting only the positive $3 would omit the adverse executions.
The SEC staff FAQ, question 38, describes a summary percentage using net improvement dollars divided by the sum of midpoint-times-executed-shares. That is different from improved-share frequency or dollars per share. Our A/B table does not contain the midpoint data needed to reproduce that percentage and should not be relabeled as that Rule 605 measure.
Check the report month and benchmark version
As checked November 9, 2026, question 39 of the SEC staff FAQ says collection of statistics relative to the best available displayed price begins November 1, 2026, and November reports may be published through the end of December. It describes the use of relevant odd-lot information for that benchmark. A collection start date does not establish that every new report is already published.
Read the actual report’s definitions and coverage. Do not mix a prior month’s national-quote comparison with a newer best-displayed-price field merely because both mention “improvement.” The FAQ is staff guidance; consult the underlying rule and current reporting documentation for compliance questions.
Compare the whole execution, including costs and quantity
The SEC’s trade-execution investor guide describes price improvement as an opportunity rather than a guarantee and discusses speed and likelihood of execution alongside price. A favorable statistic on filled shares does not describe the unfilled portion of the original objective.
For a separate invented cost comparison, suppose two executions each buy 100 shares against the same $40.04 benchmark. Route X fills at $40.02 but charges an extra $3; route Y fills at $40.03 with no extra charge. X costs $4,002 +$3 =$4,005, while Y costs $4,003. X has greater gross price improvement, yet Y costs $2 less under these stated assumptions. This is not a claim about any actual broker’s fees or routing.
Use our implementation-shortfall guide to evaluate a whole decision, including unfilled quantity and explicit costs. Our time-in-force guide explains why different order instructions can produce different filled quantities.
Applying the comparison to prediction markets
The arithmetic of comparing an execution with a clearly specified quote can be useful in event markets. It does not make stock-market reporting categories universal. Establish the exact venue, outcome, side, quantity units, timestamp and available size before choosing a benchmark.
For example, buying 100 hypothetical outcome contracts at $0.51 against a stipulated executable $0.52 offer saves $1 before charges. It does not establish a $1 profit at settlement, that $0.52 was a national consolidated benchmark, or that the contract had the same rules as another venue’s similarly titled market.
Our market-microstructure guide explains depth and execution benchmarks. Separate the quality of an entry price from whether the underlying event assessment was correct.
A price-improvement comparison checklist
- Match the reporting period, instrument population, order types and size categories.
- Identify the quote benchmark and timestamp convention.
- Separate strictly improved, at-quote and worse-than-quote executions.
- Label dollars, cents, shares, orders and percentage denominators.
- Check whether the statistic uses gross or net improvement.
- Read fill rates, execution timing, explicit costs and exclusions alongside price.
- Retain the underlying report and definitions instead of comparing advertising headlines alone.