
On this page
A confidence interval describes uncertainty about a population parameter; a prediction interval describes uncertainty about a new observation or another explicitly defined future quantity. In the common comparison below, the parameter is a population mean and the prediction target is one new observation. They answer different questions even when they have the same center.
The worked calculations are an original hypothetical Normal-model example. They are not empirical results for prediction markets, an investment forecast, or a rule that every interval must follow.
Prediction interval vs confidence interval
| Question | Confidence interval for the mean | Prediction interval for one new observation |
|---|---|---|
| What is the target? | The fixed, unknown population mean | A new observation generated by the process |
| What uncertainty matters? | Estimation of that mean | Mean estimation plus the new observation’s variation |
| Does it describe 95% of the observed data? | No | It concerns a future target, not a claim about the observed sample’s percentage inside the bounds |
| What must be specified? | Parameter, method, assumptions and confidence level | Future target, model, information set and coverage level |
The NIST handbook separately discusses estimating an average response and predicting a new individual response. For the latter, it combines uncertainty in the estimated response with variation in a new independent measurement.
Original example: a mean near 50 and a variable next observation
Assume observations are independent and identically distributed Normal variables with an unknown mean μ and a known population standard deviation σ =10 units. A sample of n =25 has observed mean 50. One future observation is independent of the sample and comes from the same distribution.
The value 10 is stipulated as known population variability. It is not an estimated sample standard deviation. The observed mean 50 is a supplied hypothetical summary, not a claim about a real dataset.
Let z be the standard Normal 97.5th percentile, approximately 1.9599639845. The two-sided nominal coverage is 95%. Under these assumptions:
- The sample mean has standard deviation
σ ÷sqrt(n) =10 ÷5 =2. - The difference between a new observation and the sample mean has variance
σ² +σ²/n =100 +4 =104, because they are independent. - Its standard deviation is therefore
sqrt(104) ≈10.1980.
The added 100 is the new observation’s own variance. More precise estimation of the mean does not remove that stipulated variation.
Calculate the two intervals
| Target | Formula for this known-σ model | Calculation | Rounded interval |
|---|---|---|---|
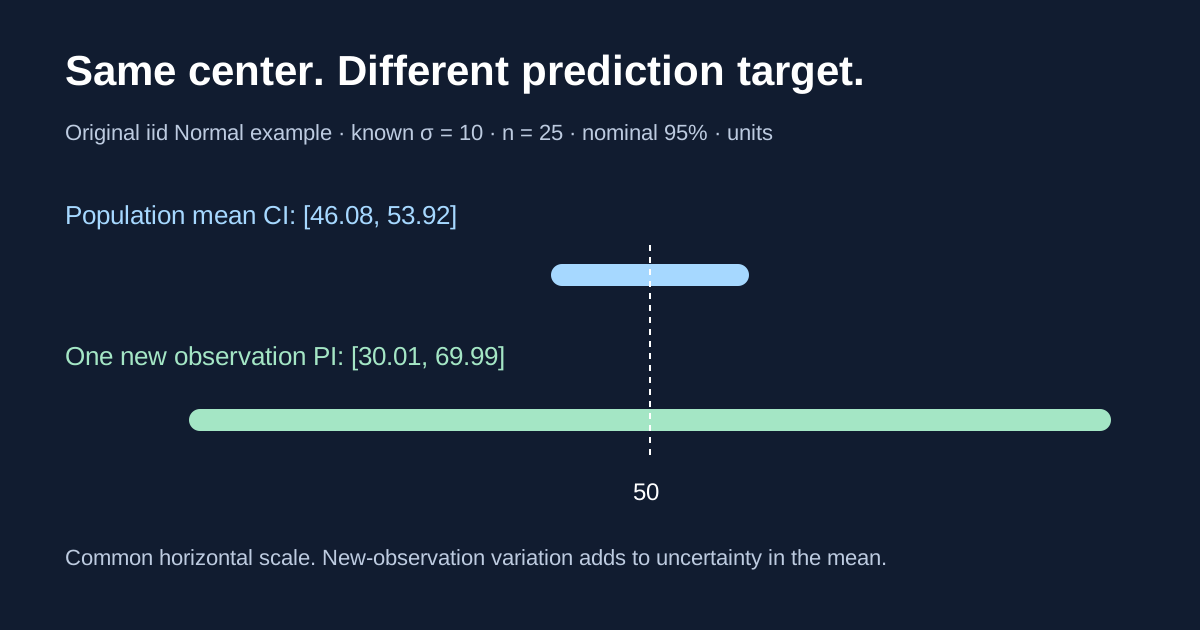
| Population mean μ | sample mean ±z ×σ/sqrt(n) | 50 ±3.9199279691 | [46.08, 53.92] |
| One new observation | sample mean ±z ×σ ×sqrt(1 +1/n) | 50 ±19.9877892062 | [30.01, 69.99] |
The prediction interval is about 5.099 times as wide as the confidence interval in this example: the ratio of the half-widths is sqrt(1 +1/n) ÷(1/sqrt(n)) =sqrt(n +1) =sqrt(26). Full widths have the same ratio.
Both centers equal 50, but using the confidence limits as bounds for the next observation would omit most of the relevant variability. The comparison is between the same model and the same nominal level; intervals from different models, targets or levels need not follow the same width ordering.
What does 95% mean?
NIST’s confidence-limits explanation describes coverage as a property of the procedure across repeated samples. In the frequentist mean-interval interpretation, μ is fixed. After computing a particular interval, it either contains μ or it does not; a 95% label does not by itself assign a 95% posterior probability to that fixed parameter.
Under our stipulated Normal model, repeatedly drawing a fresh 25-observation sample and constructing the mean interval would cover the fixed μ in 95% of repetitions before rounding. Repeating the sample-and-new-observation experiment would put the new observation inside its prediction interval in 95% of repetitions.
These are model-based coverage statements. They are not promises that exactly 95 of any next 100 real-world outcomes will be inside reported bounds, or evidence that a fitted model’s assumptions hold.
What changes with a larger sample?
Keep the same known σ =10 and, for comparison, stipulate an observed sample mean of 50 again. With n =100, the mean interval becomes approximately [48.04, 51.96], while the interval for one new observation becomes approximately [30.30, 69.70].
The confidence half-width halves from about 3.9199 to 1.9600. The prediction half-width falls only from about 19.9878 to 19.6974. Within this model, as n increases without bound, the first half-width approaches zero while the second approaches z ×10 ≈19.5996.
This is a comparison holding the assumed distribution and displayed center fixed. A newly collected sample need not have the same mean. A changing process, dependence or a different model requires a different analysis.
Predicting a future average is another target
Suppose the future target is the average of m =25 new independent observations rather than one observation. Under the same known-σ setup, the difference between that future average and the existing sample mean has variance σ²/m +σ²/n.
With n =m =25, its standard deviation is sqrt(4 +4) =sqrt(8). Its 95% prediction interval is approximately 50 ±5.5436, or [44.46, 55.54]. That interval is narrower than the single-observation prediction interval but wider than the interval for the fixed population mean.
NIST’s Dataplot prediction-limits reference explicitly distinguishes a future sample mean from a single observation. Its displayed formula uses an estimated standard deviation and a t coverage factor. Our calculations instead use known σ and a Normal factor; do not substitute s for σ while silently keeping every other assumption unchanged.
Why this is not a universal forecasting formula
A regression interval at a specified predictor value depends on the fitted model and uncertainty at that value. A time-series prediction interval depends on the forecast horizon and the model’s dependence structure. Neither can automatically be replaced by our independent-sample formula.
The NIST regression discussion explains the new-response variance term in its fitted-model setting. Use the actual method’s documentation and assumptions. A narrower interval can reflect missing sources of variation rather than better forecasting.
For event-market questions, first identify whether you are forecasting a numeric quantity, assigning probability to a defined binary outcome, or estimating a parameter. A single outcome probability such as 70% is not itself a confidence interval. Our Brier score calculator evaluates recorded binary probabilities; our forecast-error guide evaluates numeric point predictions.
Reproduce and label the calculation
Download the standard-library Python calculation. It prints the known-σ intervals for n =25 and n =100, the future-mean interval, and the variance terms used above. It does not fit a model or validate assumptions about real observations.
- Name the target: parameter, new observation or future average.
- Record the model, information date and any forecast horizon.
- State whether the population variability is known or estimated.
- Use the appropriate coverage factor and variance calculation.
- Report the nominal level, units and rounding.
- Evaluate coverage on suitable future observations before making performance claims.
For a different model-based distinction between uncertainty about parameters and conditional outcome variation, read epistemic uncertainty. It uses its own explicitly stated probability model rather than these interval formulas.