
On this page
Market microstructure studies how trading happens and how that process affects prices, liquidity and execution. It asks who can submit orders, what information is visible, how counterparties meet and which rules determine a trade’s price and quantity.
In prediction markets, the event thesis is only part of the decision. A displayed probability does not tell you the price available for your entire order, whether a resting order will fill or what happens when quotes change.
What is market microstructure?
The Bank of England’s market-microstructure discussion, in its 2011 Q4 Bulletin, examines price formation through the trading process. It considers participants, information, matching rules and venues. Its discussion of transparency also cautions that greater disclosure need not have a uniformly positive effect on liquidity.
This is a conceptual reference, not a description of today’s prediction-market rules. For a particular instrument, use the venue’s current documentation and the actual contract specification.
Five questions to ask before interpreting a market price
| Question | What to inspect | Why it matters |
|---|---|---|
| What does the displayed number represent? | Last trade, midpoint, best bid, best ask or an indicative estimate | They need not equal your execution price |
| How much is available? | Quantity at each price level | A small quote may not cover your order |
| How are orders matched? | Applicable matching and priority rules | A price match alone need not guarantee a fill |
| When does trading occur? | Continuous matching, a defined auction or a quote’s validity window | Waiting changes exposure to new information |
| What remains after execution? | Filled quantity, residual orders, cash and inventory | An acknowledgment is not a completed trade |
Original order-book example: a 50¢ midpoint, a 52¢ average purchase
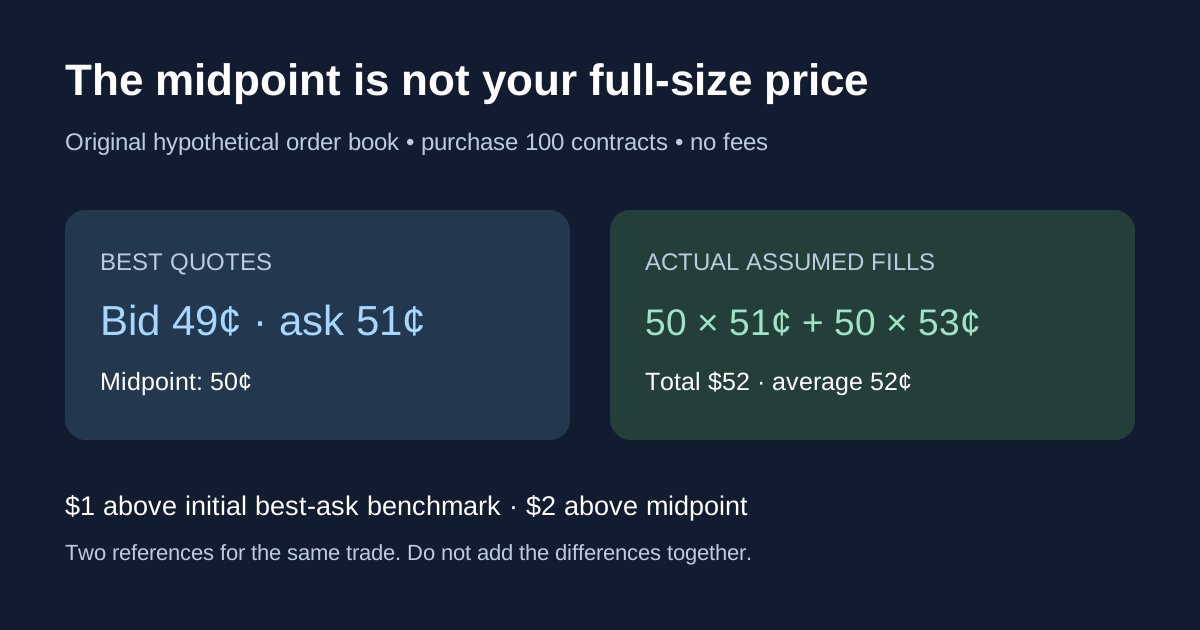
Consider a fictional binary Yes contract paying $1 for Yes and $0 for No. The best bid is $0.49. The displayed offers are 50 contracts at $0.51 and 150 at $0.53. Assume these offers remain unchanged and available throughout one immediate purchase, with no fees or other trades.
| Offer | Available quantity | Quantity bought | Cost |
|---|---|---|---|
| $0.51 | 50 | 50 | $25.50 |
| $0.53 | 150 | 50 | $26.50 |
| Total | 200 | 100 | $52.00 |
The best-quote midpoint is ($0.49 +$0.51) ÷2 =$0.50, and the quoted spread is $0.02. Buying 100 costs $52, so the average execution price is $0.52. The cost is $1 above buying all 100 at the initial best ask and $2 above buying all 100 at the initial midpoint.
Those are two different benchmarks, not two costs to add together. The $0.01 per-contract difference from the initial ask and $0.02 difference from the midpoint describe the same purchase relative to different references.
A buy limit of $0.51 would make the $0.53 level ineligible. In this stipulated snapshot, no more than 50 contracts can execute immediately at or below the limit. What happens to the remaining 50 depends on the order’s time-in-force and venue rules; the limit alone does not specify that behavior.
A different mechanism: request a firm quote for the whole size
For comparison, suppose a separate hypothetical dealer offers a firm quote to sell exactly 100 identical contracts at $0.515 each, valid when accepted. Assume the contract, timing and costs are otherwise identical and the full quote executes.
The total is 100 ×$0.515 =$51.50, or $0.50 less than the $52 order-book purchase. The example illustrates how a size-specific quote can differ from sweeping visible levels. It does not show that dealer quotes or request-for-quote systems are generally cheaper. A different quote, fee, size, timing or contract would change the comparison.
A third mechanism: collect orders for one clearing price
Now define an invented batch auction. At each candidate price, count eligible buy and sell quantities. Execute at the price with the greatest possible matched quantity. In this example there is a unique maximum, so no tie-break rule is needed.
| Candidate price | Eligible buy quantity | Eligible sell quantity | Possible matched quantity |
|---|---|---|---|
| $0.50 | 100 | 60 | 60 |
| $0.51 | 100 | 100 | 100 |
| $0.52 | 40 | 100 | 40 |
The specified rule selects $0.51 and matches 100 contracts. The schedules are hypothetical: buy interest falls from 100 to 40 above $0.51, while sell interest rises from 60 to 100 at $0.51. This is a different collection of orders from the continuous-book example. Its result cannot be interpreted as savings available by switching an actual order to an auction.
A real auction needs more rules: permitted prices, timing, ties, allocation, order eligibility and handling of unmatched orders. Stating “auction” does not supply those details.
Information and inventory affect execution
A maker posting an offer does not know every future fact. A participant who processes relevant information sooner can choose whether to trade against it. Our adverse-selection guide demonstrates why the expected value among filled orders may differ from the value before selection.
Inventory creates another issue. One side of a two-sided quote may fill while the other does not, leaving a position exposed to price changes. A displayed spread is therefore not a booked round-trip profit. Keep spread capture, inventory changes, fees and incentives separate.
These mechanisms can overlap. A negative result by itself does not identify which mechanism caused it, and public trade records may not reveal a counterparty’s information.
Applying the framework to Kalshi and Polymarket
Kalshi’s order-book explanation describes resting orders and the ability to display bids or asks. To interpret its specific representation, use our Kalshi order-book guide. For the other venue, read the Polymarket order-book guide and keep its instrument and account context explicit.
For either venue, do not treat a chart point as a promise to execute your full size. Identify the exact outcome, timestamp, side, size, eligible price increments and applicable order behavior before comparing records. Check fees separately rather than importing the no-fee assumptions in the examples above.
To reconcile an entire intended order, including the unfilled remainder, use our implementation-shortfall examples.
To distinguish quote changes from completed trades, see the original ledger in our order-flow imbalance guide.
A small execution-research worksheet
- Save the instrument, outcome, timestamp and order intent.
- Record the benchmark before the trade: last price, midpoint or executable quote.
- Preserve visible price levels and quantities for the intended size.
- Record actual fills and residual orders separately.
- Add costs in consistent units without adding overlapping benchmark differences.
- Compare subsequent prices only at prespecified horizons.
- State missing data, cancellations and assumptions.
Our slippage calculator explores supplied depth assumptions; it does not guarantee an executable quote. The volume and open-interest guide explains why activity and outstanding positions answer different questions. Use event research for the underlying thesis and timestamped execution records for the trading-mechanism analysis.