
On this page
Order-flow imbalance measures changes in supply and demand at the best bid and ask over a chosen interval. It can include added and removed resting quantity, not just completed trades. Specify the definition before comparing an “imbalance” number from a chart or dataset.
Cont, Kukanov and Stoikov’s original paper studies best-quote events in 50 US stocks and their relationship to short-interval price changes. Its empirical findings are not a tested prediction-market trading strategy. The examples here are invented to explain measurement.
Order-flow imbalance, order-book imbalance and trade imbalance
| Measure | What it describes | What must be specified |
|---|---|---|
| Order-flow imbalance | Signed changes in bid/ask supply and demand across events | Event rule, price changes and aggregation window |
| Order-book imbalance | A comparison of displayed bid and ask quantities at a snapshot | Levels included and normalization |
| Trade imbalance | A comparison of signed executed activity | Trade-direction classification and interval |
A snapshot can have more bid quantity while recent events remove bids. A quote can change without any trade. Conversely, a trade can occur while a queue is replenished. These describe different records, so matching their names or signs does not make them interchangeable.
A simple formula when the best prices stay fixed
For this fixed-price teaching segment, let B be the quantity at the best bid and A the quantity at the best ask. Define each contribution as e = change in B − change in A, then add contributions over the interval.
Adding bid quantity contributes positively; removing ask quantity also contributes positively. Removing bid quantity contributes negatively; adding ask quantity also contributes negatively. This is the unchanged-price special case of the paper’s best-quote measure. Do not apply this shortcut across price changes.
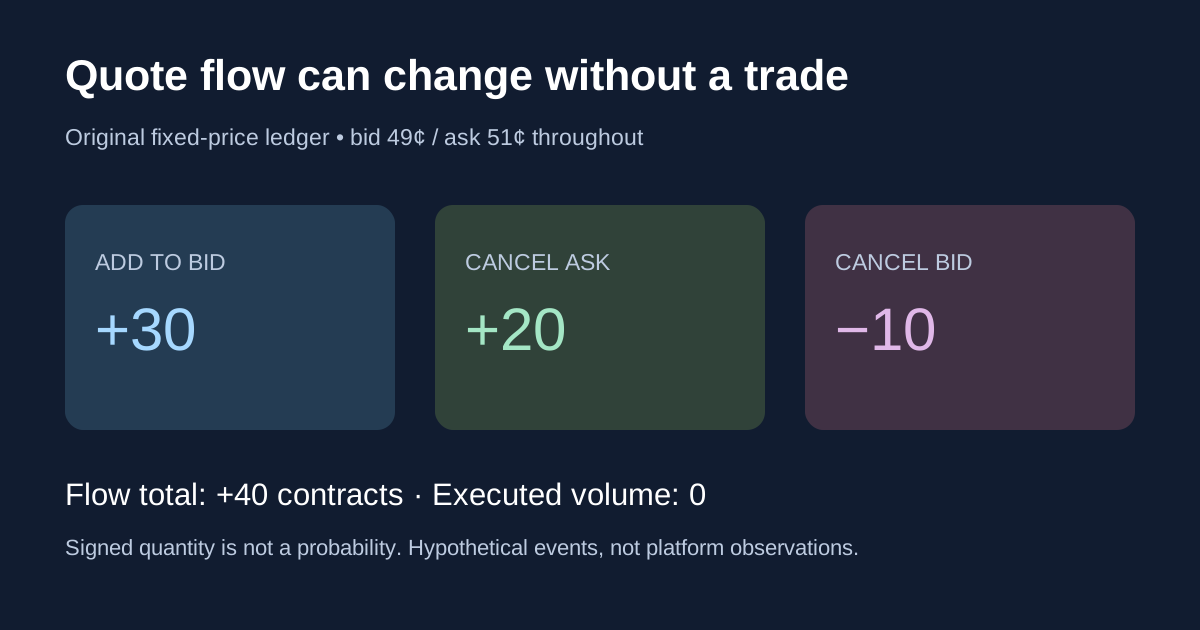
Original ledger: +40 contracts of flow, zero executed volume
Consider a fictional contract with best bid $0.49 and best ask $0.51. Initially, 100 contracts rest at the best bid and 80 at the best ask. Assume all three events below occur at those same prices, in order, with no fills.
| Event | Bid quantity after event | Ask quantity after event | Signed contribution |
|---|---|---|---|
| Start | 100 | 80 | No contribution |
| Add 30 contracts to best bid | 130 | 80 | +30 |
| Cancel 20 contracts at best ask | 130 | 60 | +20 |
| Cancel 10 contracts at best bid | 120 | 60 | −10 |
The interval’s flow imbalance is +30 +20 −10 =+40 contracts. A direct unchanged-price check agrees: bid quantity rose by 20, ask quantity fell by 20, so 20 −(−20) =40.
Executed volume is zero by assumption. The +40 does not mean 40 contracts traded, 40 new buyers arrived or Yes probability rose by 40 percentage points. It is a signed quantity measure for the stipulated events.
The best prices and midpoint did not change in this example. A positive imbalance therefore does not mechanically force a contemporaneous price rise on every interval. No later return is specified.
The same ending book gives a different snapshot statistic
Define a separate top-level snapshot ratio as (B −A) ÷(B +A) when the denominator is positive. At the end of our ledger, it is (120 −60) ÷(120 +60) =1/3 ≈0.3333. Initially, it was (100 −80) ÷180 =1/9 ≈0.1111.
The ratio is dimensionless; the flow total is 40 contracts. Neither 0.3333 nor 40 is a probability that an event will occur. The ratio also uses only the displayed levels we selected, not all possible liquidity.
If both quantities are zero, this ratio is undefined. Record it as missing rather than claiming a balanced 0. If one side is absent, also inspect whether a valid two-sided quote exists before interpreting a numerical ratio.
Why a new best price breaks the shortcut
Now take a separate event after the ledger: a new bid at $0.50 displays 40 contracts, replacing $0.49 as the best bid. The 120 contracts at $0.49 remain deeper in the book. The ask stays $0.51 with 60 contracts.
Comparing only top quantities would produce 40 −120 =−80. But it would be wrong to describe that as removal of 80 contracts: the old queue did not disappear. Under the paper’s price-aware rule, an improving bid contributes the new best-bid quantity, +40 here.
The midpoint changes from $0.50 to $0.505 and the spread narrows from $0.02 to $0.01. Those price changes follow from our invented quote event, not from a fitted forecasting model. Other price transitions require their corresponding event rules; the fixed-price shortcut is insufficient.
Keep snapshots, updates and trades separate
A snapshot tells you a state. Two sparse snapshots do not reconstruct the sequence of additions, cancellations, fills and price changes between them. A vanished quantity alone does not tell you whether it traded or was canceled.
For a reproducible event study, preserve ordering, instrument identity, timestamps and the actual update convention. If a feed reports a new absolute level size, replacing it is different from adding a delta. A reconnect or missing segment requires reconciliation before continuing an interval.
Download the original event-ledger worksheet to record those distinctions. It does not fetch market data or infer missing events.
Prediction-market representation matters
Kalshi’s current order-book documentation describes YES and NO bid arrays with dollar-price and fixed-point quantity strings. For its binary representation, an NO bid at y implies a YES ask at $1 −y. The highest bids are the last entries in the ascending arrays.
For a YES-side analysis, normalize the opposite bid into the implied YES ask before applying a two-sided definition. For example, a hypothetical NO bid at $0.49 implies a YES ask at $0.51. Do not treat that NO bid as a second YES bid, or count two representations of the same liquidity as independent levels.
Use the exact outcome and current feed specification. A quantity such as "12.50" is 12.5 contracts in the documented representation, not $12.50 of traded value. Our Kalshi order-book guide covers the broader representation; the Polymarket order-book API guide covers that venue’s separate format.
An imbalance feature needs validation before a trading claim
The original stock study provides a research framework, not a universal coefficient for every venue and horizon. No Kalshi or Polymarket dataset is backtested in this guide.
If you study predictive value, choose event rules and time windows before looking at outcomes. Separate the time a message was observed from the time it affected a quote. Evaluate out of sample, preserve no-change intervals and account for executable prices, fees and missed fills. A strong association with simultaneous price movement is not automatically a forecast available before that movement.
Our market-microstructure guide explains the execution context. Use event research for the underlying thesis and properly recorded quote events for the microstructure analysis.