
On this page
The official Kalshi leaderboard is part of Kalshi Social. In our signed-out browser check on October 6, 2026, the page displayed a gate stating that the leaderboard and trade activity are available to verified Kalshi users. Use the official destination to see the current board; this article does not republish a live ranking.
Kalshi’s leaderboard help page says participation is opt-in, with accounts opted out by default. Viewing access and appearing in the rankings are separate questions. We inspected the public help and signed-out page, without signing in or changing an account’s visibility.
How to find the Kalshi leaderboard
- Open the official Social page.
- If the verification gate appears, use the official account flow and read the requirements shown to you.
- Before comparing rows, note the selected period, category and metric in the current interface.
- For participation or removal, follow the opt-in and opt-out illustrations in the official help article.
A screenshot from an older interface can be useful context, but its button positions are not proof of the current workflow. The help article includes demonstration images; inspect the controls actually shown in your account before changing what you share.
Profit, volume and predictions answer different questions
| Metric label | Useful question | What to avoid inferring |
|---|---|---|
| Profit | What result is reported for this period and scope? | A full account audit or a guaranteed future result |
| Volume | How much trading activity is measured? | How much capital remains or whether the activity was profitable |
| Predictions | What activity count is displayed? | A win rate or calibrated forecasting score without its definition |
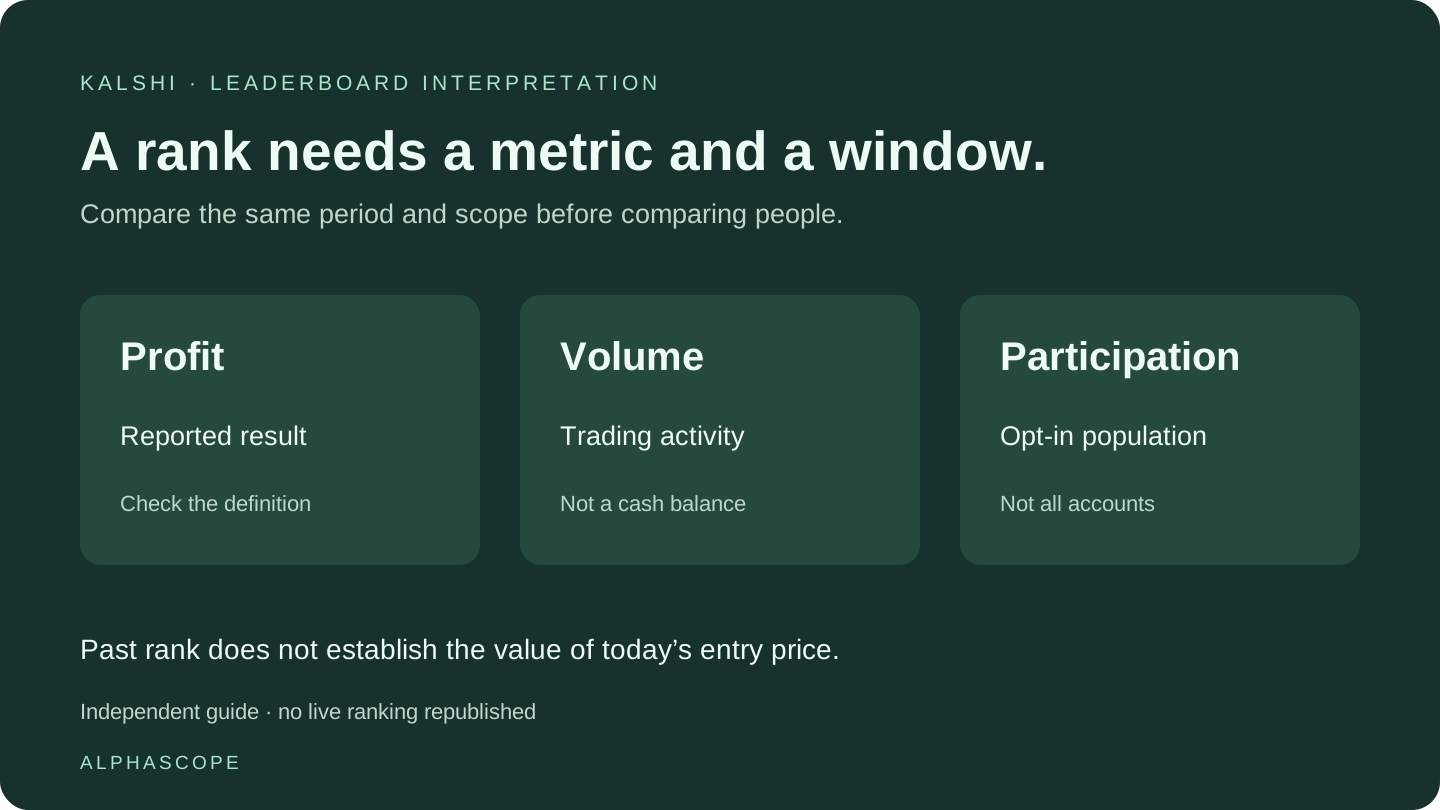
These are interpretation questions, not an undocumented formula for Kalshi’s displayed statistics. Inspect the venue’s current definitions before calculating ratios from them. In particular, dividing profit by traded volume is not automatically a return on invested capital: the same capital can turn over repeatedly.
A hypothetical comparison
Consider two invented traders over the same month. Trader A earns $2,000 against an assumed $50,000 of starting capital. Trader B earns $500 against $2,000. On absolute profit, A ranks above B. Dividing those invented profits by the assumed starting capital gives 4% for A and 25% for B.
This simple ratio is illustrative and assumes no deposits or withdrawals. It does not reproduce Kalshi’s leaderboard formula, establish risk-adjusted performance, or account for capital tied up at different times. The example shows why a profit ranking and a return ranking can answer different questions.
Now suppose A has $200,000 of reported trading volume. That number alone does not reveal starting capital, average exposure or net profit. Keep the measurement’s definition with the number instead of labeling every large activity figure a large balance.
Compare the same window and scope
Write down the selected period, category, metric and observation time before comparing participants. An all-time number and a weekly number are not interchangeable. Neither are two category-specific results if one excludes trades included by the other.
If a third-party page presents rankings, inspect its timestamp, methodology and coverage. A site may reuse venue statistics, reconstruct outcomes from a subset of trades, or combine periods differently. Similar labels do not prove identical measurements. Do not carry a ranking from one source into another without checking what produced it.
Opt-in participation limits the conclusion
Because participation is opt-in, a visible board is not a complete census of all accounts. This is a selection limitation, not evidence that visible results are false. You cannot calculate the average outcome for every Kalshi user from only the displayed participants.
A high rank can suggest a person worth researching. It does not establish why they succeeded, the losses experienced along the way, the capital required, or whether the strategy still has an attractive entry price. Examine a longer record and actual reasoning before drawing a broader conclusion.
Why copying a ranked trader can differ
Imagine an invented trader bought a contract at $0.40 and the available offer is now $0.65. A reader buying later takes a different price and therefore a different cost and potential profit. They may also face different available size, fees and settlement timing.
A ranking is a historical comparison, not an executable order instruction. Read the exact contract and current quote independently. Our Kalshi fees guide explains costs, and the profit calculator explores hypothetical trade outcomes.
If your profile or rank looks wrong
First identify the metric, selected period and visibility state. Keep a dated screenshot and compare like-for-like records. If you need the provider to explain a discrepancy, send the exact field and time through official support. A missing row does not establish a trading loss or a broken account.
For your own balances, distinguish a social statistic from cash and open positions. Read Kalshi portfolio versus cash before treating any displayed result as withdrawable money. Alphascope provides independent research; the official board and account records are the place to verify venue-reported figures.