
On this page
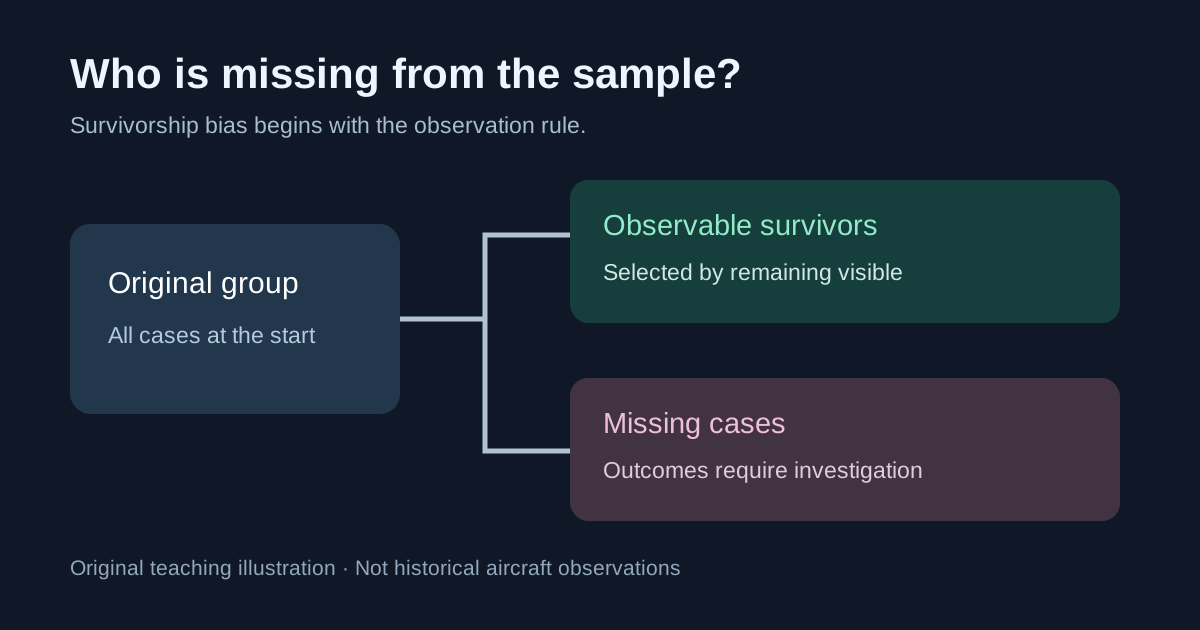
Survivorship bias is a selection problem: the cases you can still observe may differ systematically from the cases that disappeared. Conclusions about the visible survivors can therefore misrepresent the original group. The plane example makes the missing group easy to picture; a winners-only forecasting record creates the same question about selection.
The survivorship-bias plane example
Imagine examining damage on aircraft that returned from missions. Your sample contains aircraft that survived long enough to be inspected. Aircraft that did not return are missing from that inspection process. A map of damage on returning planes therefore describes damage among survivors, not the damage distribution across every aircraft that flew.
The tempting leap is to treat the most visible damage as a complete guide to vulnerability. But the observation mechanism matters: a damaged area could be common in the returned sample partly because damage there was survivable. Less observed damage elsewhere does not automatically mean those areas were rarely hit across the full group.
That is a reason to investigate missing cases and the assumptions connecting damage to survival. It is not a universal instruction to armor every area with fewer marks. Mission conditions, exposure, damage severity and the relationship between damage and return all affect an actual engineering analysis.
What did Abraham Wald study?
CNA’s 1980 reprint of Abraham Wald’s aircraft-vulnerability research collects wartime memoranda written while he was at Columbia University’s Statistical Research Group. Its subject is estimating vulnerability from damage observed on surviving aircraft.
The relevant statistical lesson is to account for how survival determines what becomes observable. The diagram on this page is our original teaching illustration. It contains no historical bullet-hole observations and does not reproduce Wald’s aircraft data.
What does survivorship bias mean outside aviation?
Start with a target population: the complete set of cases your conclusion is supposed to describe. Then identify the observed sample and the condition for appearing in it. If that condition is related to the outcome you want to evaluate, the observed result can differ from the population result.
| Visible sample | Potentially missing cases | Question before generalizing |
|---|---|---|
| Active forecasting accounts | Closed or abandoned accounts | Did performance influence who remained active? |
| Published winning calls | Unpublished or deleted calls | Were all calls recorded before outcomes? |
| Current strategies | Retired strategy versions | How many versions were tried and dropped? |
| Returned aircraft | Aircraft that did not return | How did damage affect the chance of observation? |
These are possible selection mechanisms to check, not claims about every account, strategy or dataset. A missing account is not automatically a losing account. Missing results are unknown unless you have evidence establishing them.
Original example: a profitable survivor group, a losing full cohort
Consider a completely fictional cohort of 100 equally funded forecasting strategies. Each starts with $100. We stipulate the full outcomes: 20 finish with $130 each, while 80 finish with $90 each. Assume these final balances include all costs. There are no deposits, withdrawals or differences in the evaluation period.
| Group | Strategies | Starting funds | Final funds | Profit or loss |
|---|---|---|---|---|
| Winners later featured | 20 | $2,000 | $2,600 | +$600 |
| Other strategies omitted | 80 | $8,000 | $7,200 | −$800 |
| Full original cohort | 100 | $10,000 | $9,800 | −$200 |
A page featuring only the 20 winners could accurately report that its featured strategies gained 30% each. But those strategies were selected after their results were known. Applying that 30% figure to the original cohort would be wrong: the full cohort lost 2%, or $2 per strategy on average.
The calculation is 20 × $30 +80 × (−$10) =−$200. Equal starting funds make the cohort return −$200 /$10,000 =−2%. The survivor-only result exceeds the full-cohort result by 32 percentage points. These constructed figures demonstrate selection; they are not measured returns from Kalshi, Polymarket or Alphascope.
If we knew only the 20 visible results, we could not calculate the full-cohort return. The missing 80 might have lost, broken even or gained. We know their outcomes here only because the fictional setup explicitly supplies them.
How to audit a prediction-market track record
Define the cohort before reviewing performance. For a set of forecasts, retain the original probability, timestamp, exact question and resolution rule. Include resolved failures as well as resolved successes. Keep pending, canceled and voided questions in separate, explicit statuses rather than silently turning them into successes or failures.
For trading results, a list of correct calls is insufficient to establish profitability. Entry and exit prices, position sizes, costs and unsettled positions matter. Compare like periods and distinguish account returns from a count of correct predictions. A high success rate alone does not reveal the payoff on either winning or losing trades.
Useful checks include:
- Denominator: How many accounts, strategies or forecasts existed at the start?
- Inclusion rule: Was entry into the displayed sample decided before or after the outcome?
- Attrition: Which cases disappeared, when and for what documented reason?
- Coverage: Can you reconcile every original case to a final or pending status?
- Comparability: Are dates, funding, costs and evaluation rules consistent?
- Unknowns: Which results remain unavailable, and how does that limit the conclusion?
For crowd-level judgments, our wisdom-of-crowds guide also examines participation and shared errors. A large visible crowd does not by itself establish that the missing participants resemble those you can observe.
Survivorship bias versus outcome bias and cherry-picking
Survivorship bias concerns selection into the observed sample. Outcome bias concerns judging a decision using its eventual result instead of assessing the evidence and process available at the time. The same winners-only portfolio can invite both errors, but the questions differ: who is missing, and how was decision quality assessed?
Deliberate cherry-picking can create a survivor-only display, but no deliberate deception is required. Records can disappear because a service closes, an account is abandoned or a tracking system retains only active items. Investigate the mechanism before assigning intent.
A short missing-results worksheet
Write down five items before relying on a success story: the original population; the observable subset; the rule that determined visibility; the unavailable outcomes; and the claim the available evidence actually supports. If the denominator cannot be established, state that limitation instead of inventing an overall rate.
Alphascope’s market news can support an evidence trail for questions you follow. Save the underlying sources and your own dated forecast record. A polished retrospective should not replace the complete set of predictions that existed before outcomes were known.