
On this page
An overconfidence bias example is someone expecting to answer eight of ten questions correctly, then answering six correctly. That illustrates overestimation of performance. Believing you will outperform peers, or giving an unjustifiably narrow uncertainty range, raises different questions. To evaluate confidence, specify exactly what was claimed and what would count as evidence.
What is overconfidence bias?
Overconfidence means confidence exceeds what an appropriate comparison supports. The comparison might be actual performance, performance relative to others, or the uncertainty around an estimate. Enthusiasm or decisive language alone does not establish any of those mismatches.
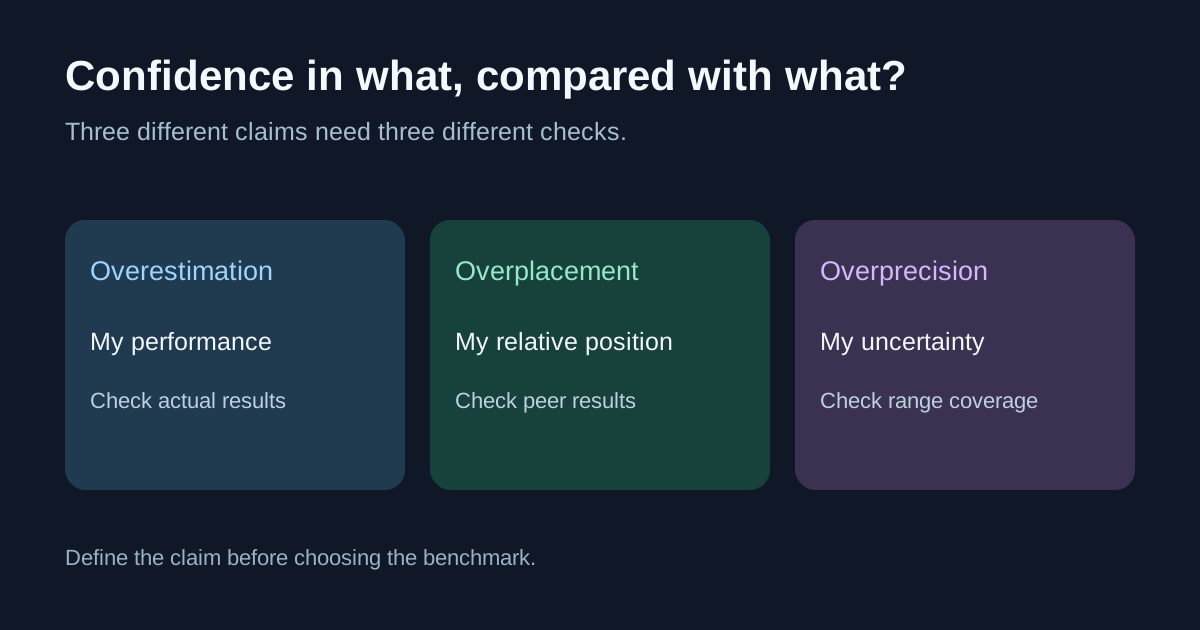
In Moore and Healy’s research on overconfidence, the authors distinguish overestimation, overplacement and overprecision. Their work also examines how task difficulty changes the relationship between different measures. Treating them as one interchangeable trait can hide important differences.
Three types of overconfidence, with original examples
The following numbers are invented teaching examples, not observations from the cited study.
| Type | Claim before the result | Observed comparison | Mismatch |
|---|---|---|---|
| Overestimation | “I will score 8 out of 10.” | The score is 6 out of 10 | Own performance was overestimated by 2 points |
| Overplacement | “I will score 2 points above the peer average.” | Own score is 6; peer average is 7 | Expected relative advantage +2; actual difference −1 |
| Overprecision | Ten numerical ranges are each assigned 90% coverage | Six of the ten realized values fall inside their saved ranges | Observed coverage is 60%, below the assigned 90% |
These examples describe observed gaps. A small collection of results does not by itself prove a persistent psychological tendency. Chance, task selection, measurement error and the information available beforehand matter. Repeated, prospectively recorded comparisons are more informative than an anecdote selected after the fact.
The distinction matters even within one quiz. Someone can underestimate their own score while overestimating how much better they will perform than peers. The absolute estimate and the relative estimate need separate benchmarks.
A forecasting example: 90% claims and 60% observed frequency
Consider a fictional record containing 100 binary forecasts, all saved before outcomes and all assigned a 90% probability of Yes. Assume all 100 questions resolve under their original definitions, with no missing, voided or selectively deleted cases. In this constructed record, 60 resolve Yes and 40 resolve No.
The average predicted probability is 90%. The observed Yes frequency is 60 /100 =60%. That is an observed overprediction gap of 30 percentage points for this set. The forecast probabilities imply an expected total of 90 Yes results if they are the relevant event probabilities; this expectation does not require the events to be independent.
| Quantity | Value in the example |
|---|---|
| Forecast count | 100 |
| Saved probability for each Yes | 90% |
| Observed Yes count | 60 |
| Observed Yes frequency | 60% |
| Predicted minus observed frequency | 30 percentage points |
This is a calibration check for one probability group, not a diagnosis of why the gap occurred. Dependence between questions, a shared shock and the way questions were chosen affect how much evidence the record provides. One hundred forecasts about closely related outcomes do not necessarily provide one hundred independent tests.
Nor does one No outcome refute a 90% forecast: a 10% chance of No was part of that forecast. Review a defined collection of cases and their context instead of labeling every confident miss irrational. Our outcome-bias guide explains why a single result is an incomplete verdict on the original decision.
What overconfidence can look like in market research
For a Kalshi or Polymarket question, confidence needs an exact object: the contract’s defined outcome by its stated deadline. A broad belief about a company, election or economic trend may not answer that contract. Save the resolution condition alongside your estimate so the eventual evaluation tests the same claim.
Distinguish your probability from the displayed trading price and record the timestamp. A difference is a disagreement to investigate; it does not establish that either number is correct. A confident research story can still omit contrary evidence or misunderstand the rule being priced.
Forecast accuracy and trading performance also require different records. A correct Yes call need not be profitable after entry price and costs. A profitable trade need not prove the probability estimate was accurate. Keep the forecast record separate from execution and return calculations.
How to reduce overconfidence: make the claim testable
The following workflow makes confidence easier to inspect. It is a practical review method, not a guarantee that a bias disappears.
- State the claim precisely. Record the event, deadline, probability or range, and what information was available.
- Choose the comparison. Are you checking your score, your rank relative to peers, a probability group or interval coverage?
- Write the failure case. Identify evidence or a mechanism that could make your current explanation wrong.
- Check a relevant baseline. Compare with a clearly defined reference group or prior frequency when suitable; explain mismatches rather than applying a base rate mechanically.
- Retain the complete set. Preserve misses, updates and pending statuses under a consistent inclusion rule.
- Review recurring gaps. Separate a one-off surprise from patterns that survive checks for selection, dependence and changed definitions.
Do not mechanically replace every 90% estimate with 60% because of the fictional calculation above. A revision should follow from relevant evidence and a defensible model. See base rate neglect for baseline questions and survivorship bias for missing-result checks.
To distinguish missing knowledge from outcome variation under a model, see our epistemic versus aleatoric uncertainty guide.
A confidence-review worksheet
For the next forecast you evaluate, save: the original claim; the confidence measure; the comparison group; the strongest contrary evidence; the result or pending status; and the specific change justified by the review. If the evidence is insufficient, record that uncertainty instead of forcing a conclusion.
Alphascope’s market news can help organize sources for this process. Verify important facts in primary sources, retain the original contract details and explain whether an update follows new information or simply a stronger feeling of certainty.